Taxonomies, Ontologies and Knowledge Graphs: a primer


I’ve lived in this world long enough that some of these ideas just feel obvious to me, but I’ve learned they often aren’t.
In most workplaces I’ve been in, fluency in how these ideas connect between data, code and software - is surprisingly rare - even with extremely smart people.
Why is this useful to know?
Code and data represent real life entities - whether physical (ie a person) or abstract (a person's intended food order).
The better we get at articulating these using these concepts, the easier it is to understand how to communicate what people need in a way that can be then put in code or represented in data. This means less bad software.
Also this all got extremely fashionable recently with LLM and GenAI technologies getting popular and mainstream attention.
Why on earth do I know this

Fair question. This stuff doesn’t exactly come up at parties.
Personal: I've spent my life codifying and analysing human behaviour as a compensation measure for how my brain thinks to ensure I try to be a good person. I'm now well into adulthood so it's all pretty automatic but it does mean any framework that helps me understand human behaviour and interaction in a more codified manner just sticks without much effort.
Professional: I've worked in a bunch of industries where defining how something relates to what is hard work. Want to know how a ship owner differs from a ship operator, and how that relates to Lloyds register or an individual seafarer? Or how to define the long set of complex interrelating circumstances that can affect blood glucose levels in a way that someone can read on a phone screen? Or you're a startup who is pivoting what they do and need to understand what still works in the new world?
I've also done enough training and usage of things like Human Activity Models in a real business context... deeply nerdy and dull, enthralling to me.
I even went a bit overboard on this recently and volunteered to stand on stage and try to explain British rail privatisation (and it's imminent sort of nationalisation) at emfcamp.
So, here’s my attempt to make the invisible structures we work with every day a bit more visible.
Taxonomy
A taxonomy classifies stuff into categories. They started getting proper popular in the Victorian (1800s) era in zoology and palaeontology and other areas.
These can be hierarchical, so:
This is Miska and Sasha. They are cats, which are a type of animal.
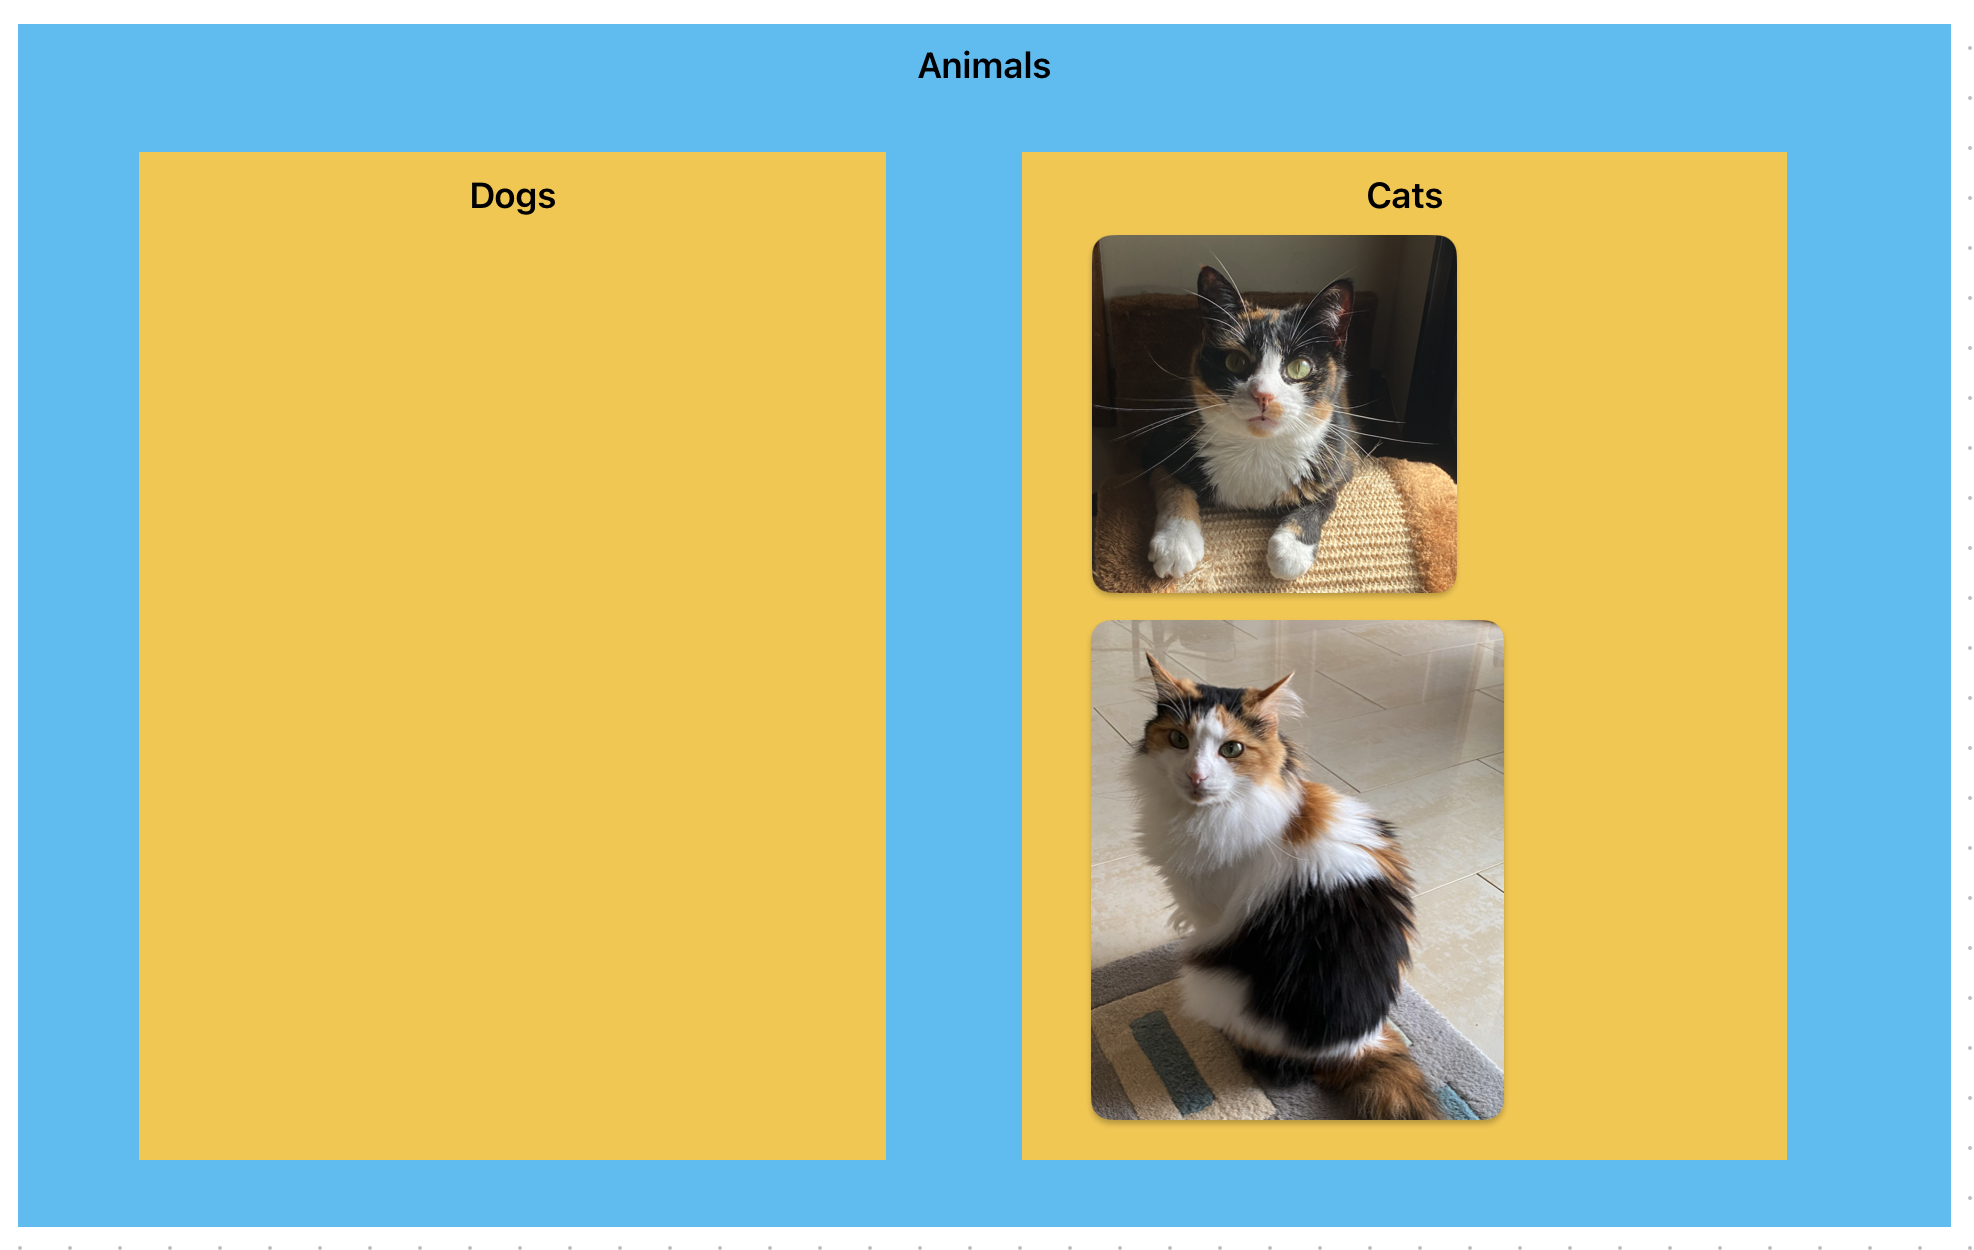
I've used a nested venn diagram here to show that the cats are animals. And that dogs are also animals, but my cats are not dogs.
However, trying to use this for more types and groups becomes very space intensive, so we instead do it like this:
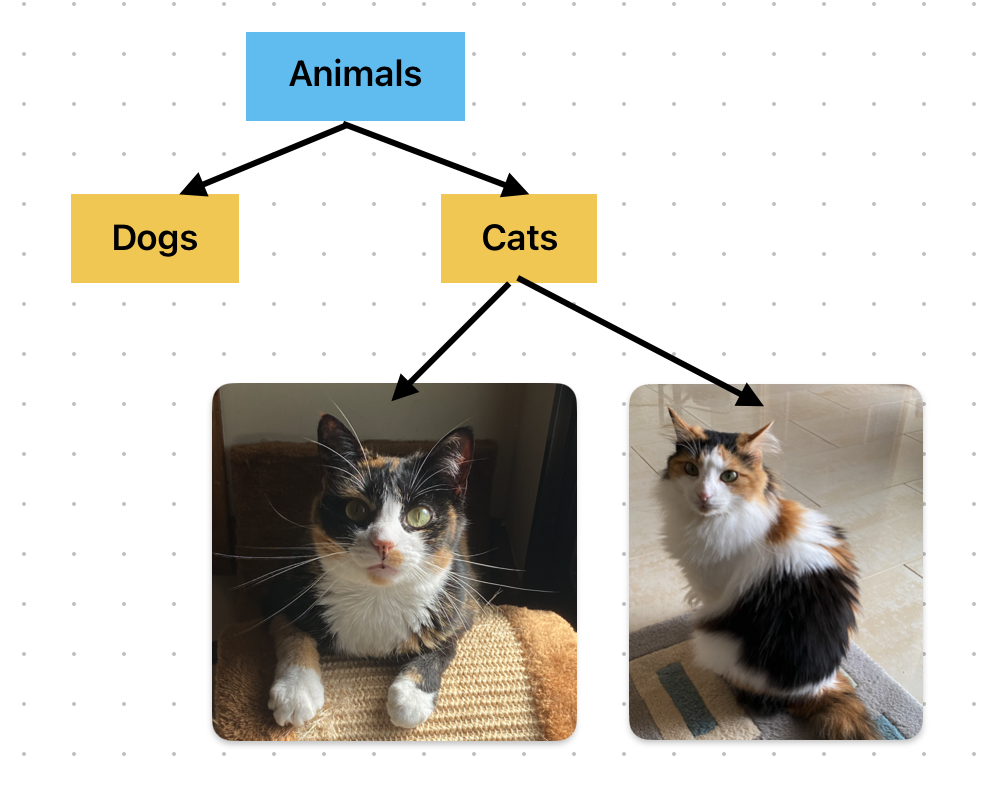
If you write code, you might notice this looks a lot like inheritance ie traits passed down a hierarchy. Almost like the cats would inherit traits associated with animals but not dogs? Right?
For computers to classify things, and for that output to be helpful, we have to understand how things might get classified.
But actually... this is much more business than dogs and cats. For example, Excel spreadsheets in their simplest form are very good at showing data with one "layer", eg:
| Name | Gender | Hair Type |
|---|---|---|
| Sasha | Female | Short-hair |
| Miska | Female | Long-hair |
But if you traverse up the tree you end up repeating labels which makes stuff harder to read, eg:
| Type | Species | Domestication | Name | Gender | Color |
|---|---|---|---|---|---|
| Animal | Cat | Pet | Sasha | Female | 3-colour |
| Animal | Cat | Pet | Miska | Female | 3-colour |
| Animal | Cat | Pet | Garfield | Male | Orange |
| Animal | Dog | Pet | Doug | Male | Light Brown |
So there are lots of Excel features designed to make this easier, for example pivot charts. But frequently, when an excel spreadsheet becomes difficult to understand, it's because it's trying to convey information further up the hierarchy which is probably better suited to dedicated database software.
In short, a taxonomy tells you what something is (well their categories), but not how it relates to everything else. For that, we need an ontology.
Ontology Diagrams

So, ok, objects and concepts don't exist without having a relationship with other objects and concepts. My cats are owned by me and my husband (although they may want to debate that with us). Cats eat food, they sit on sofas, lounge on beds and even have dreams.
Ontologies are often used to help make sense of data, eg a document could be an invoice or a sales order, and have a lot in common with each other, but how they are different are the different things you expect to be able to do. For example:
- you send an invoice to a customer and expect them to pay you money
- but a customer sends a sales order to you and expects you to give them goods or services
- But money can also be exchanged directly for goods or services without a sales order or invoice, but a receipt instead....
You can now see how this might get messy.
Ontologies are also useful for determining software logic eg an invoice can be "not sent", "sent", "paid" or "cancelled". But it shouldn't be "on fire".
You map that using an ontology. There are tonnes of ontology model types out there and diagram types that do this.
If this topic excited you I suggest this link here: https://medium.com/codex/understanding-ontologies-and-knowledge-graphs-4664afc4f961
Knowledge Graphs
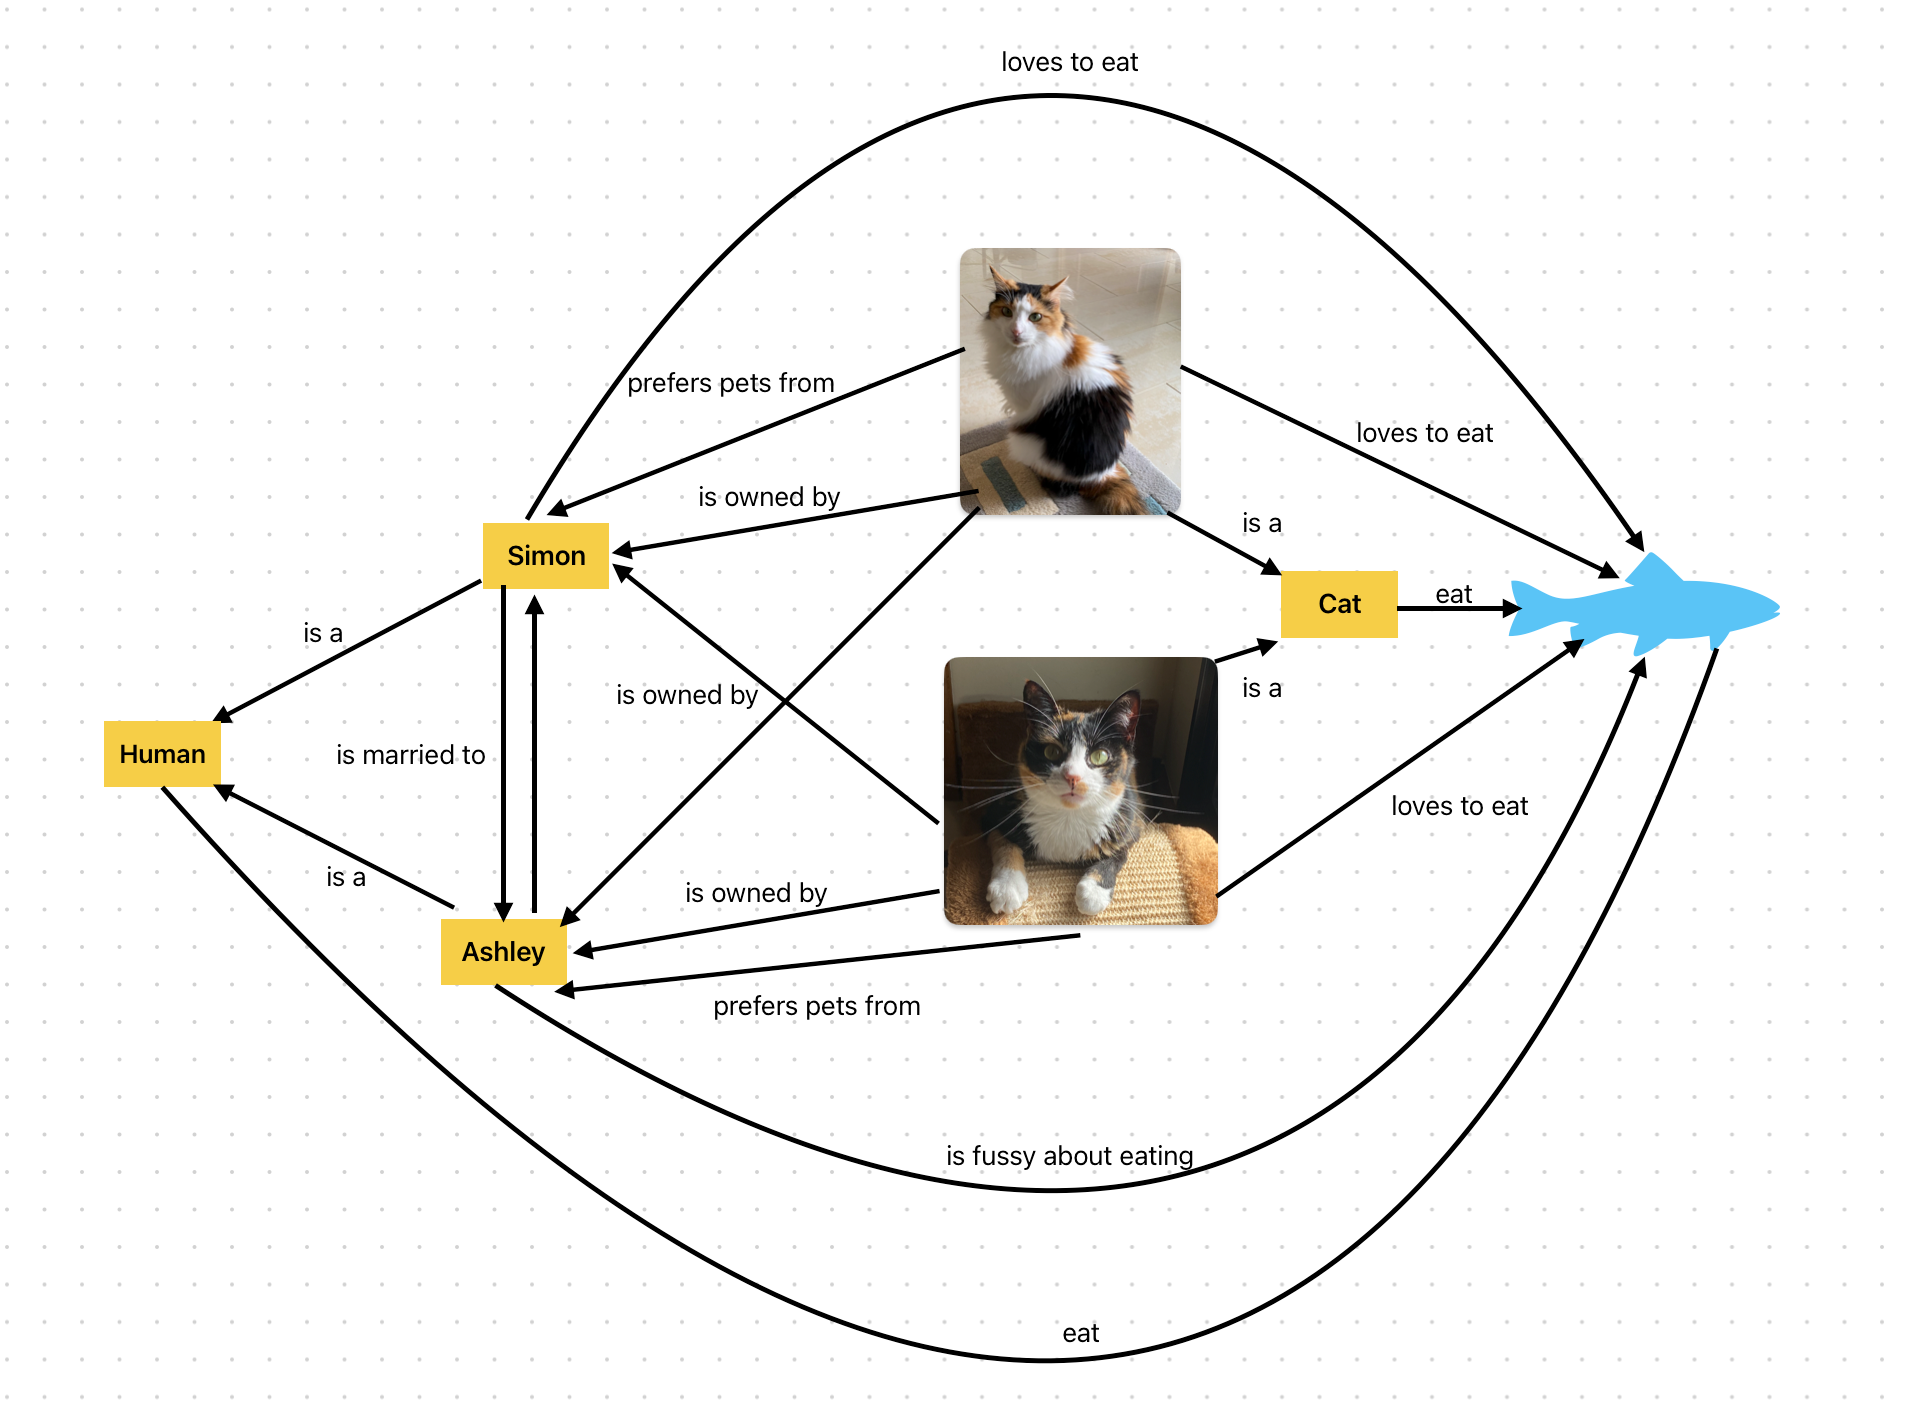
Knowledge graphs are basically a little less rigid, but allow you to see the relationships between entities like an ontology does. They're also assumed to be edited in real time. They are how we can start to give some structure to LLM "AI" agents like ChatGPT.
If an ontology is a beautifully tidy filing cabinet, a knowledge graph is the messy, living network of relationships that grows as people interact with data in real time. In my very simple example, I'm already aware it would be a mess if I start adding more concepts eg which cat was adopted by which person, other foods we and the cats do and don't like, places we might live or sleep, and so on.
Once you start mapping relationships, you quickly realise that you’re not just describing data or code. You’re instead describing entire systems of people, processes and feedback loops.
Systems Thinking
One of those messy jobs done in software is obtaining and translating what I called the "assumed structure" that exists in peoples heads. This has to be done to write good UI components and copy in your software, and to define things like data models efficiently (it’s the mental map of how people think things work). But because it’s already happening implicitly, it’s often done badly.
This is basically the foundation of that phrase that is becoming an annoying buzzword devoid of its original meaning: Systems Thinking. The idea of taking the whole context and thinking about it as part of a whole, as opposed to only considering the software itself.
But this has some super cool stuff in it that doesn't get mentioned often, so let's give them some love below, although I apologise in advance for their extremely dry names:
- System Dynamics → eg a simulated city traffic model: how one road closure ripples across the network. (also why your shower is never at the right bloody temperature).
- Viable System Model (VSM) → eg checking if a company’s feedback loops are healthy
- Strategic Options Development and Analysis (SODA) → mapping different stakeholder perspectives in a startup pivot.
- Soft Systems Modelling → capturing how humans think a situation works, and comparing with other humans to spot patterns and gaps. It's where human activity modelling lives too.
- Critical Systems Heuristics (CSH) → asking critical questions to uncover hidden assumptions, like detective work in decision-making.
Don't Forget The Fundamental Point
All of these models and tools are attempts to describe the real world - both visible and invisible parts. They cover:
- what something is
- how it might relate to something else
- what might happen if something happens
Originally, all of this came from trying to codify the real world for computers. But it has since wandered into management science, organisational psychology, and many other areas. That is actually a good thing, because all these fields benefit from cross-disciplinary insight.
The old boundaries, like “hard vs soft science” or “mechanics are for STEM, statistics are for the social sciences,” never really held up historically, but are much more noticeable now. With AI systems using things like knowledge graphs, those neat little boxes have been thoroughly shaken up.
And large language models (LLMs), such as ChatGPT, have made that very visible. They do not actually know anything. What looks like knowledge is really structure we add afterwards, through the slow human work of analysing how the world works and putting it into a form computers can use.
If we want better software, AI or not, we need to get better at communicating the real world to it. The clearer we are about how things actually fit together, the more sense our systems and the tools we build will make, and the more helpful they will be.


